
Accuracy of Digital Ellipse Marking for Bloodstain Pattern Analysis
 Eugene Liscio, P.Eng.
Craig C. Moore, BSc.
Abstract
This blind study looked at the accuracy of 101 individuals and how well they could mark a set of 18 digital images of perfect ellipses. The ellipses were created in a 3D modeling program thereby eliminating subjectivity due to blurred images, low resolution, extended tails, wave cast-off or other spatter stain defects. The images were 1600 x 1600 pixels and minimum number of pixels for the smallest ellipse was approximately 830 pixels while the longest ellipse was approximately 1370 pixels long. These digitally created bloodstains ranged from 5° to 90° with participant errors increasing noticeably for bloodstains greater than 70°. Bloodstains which were perfect circles (90°), were the most problematic and had errors greater than 7° although the mean error was slightly over 3°. The results of this study provide a “ground truth” for the best possible conditions an analyst may have when marking bloodstains.
INTRODUCTION
Bloodstain pattern analysis relies heavily on the understanding and classification of bloodstains found at a crime scene. Analysts examine the size, shape, distribution and location of the bloodstains to try and determine things such as where an assailant may have been located or where a victim was struck. When considering impact stains, both the area of convergence and area of origin 1 may be calculated to demonstrate where the impact took place in two -dimensional or three-dimensional space. Traditional methods of stringing and newer, digital methods often involve identifying and selecting bloodstains to include in an analysis.2 Part of this process requires that the analyst measures the width and length of each bloodstain and often, this can prove to be a difficult exercise since bloodstains are not always found in perfect form. Depending on factors such as environmental conditions and surface properties of a target surface, bloodstains may be malformed and require some knowledge to interpret the correct shape.
Marking errors resulting from incorrectly marked bloodstains (i.e. the marked shape of the ellipse does not agree with the known impact angle or true width to length ratio of the bloodstain) contribute to the overall errors in an area of origin or convergence analysis. Errors may be due to an analyst’s subjective interpretation which may be complicated by malformed bloodstains and estimations of where to place an accurate ellipse around an individual bloodstain. One question which has not been addressed in ellipse marking studies is performance when bloodstains are near perfect and photographs are of high quality. Thus, this study addresses a best-case scenario for analysts when most problems associated with bloodstain ellipse marking have been removed.
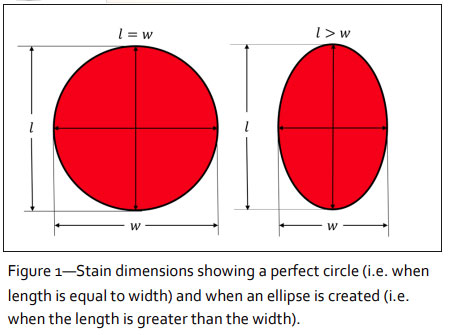
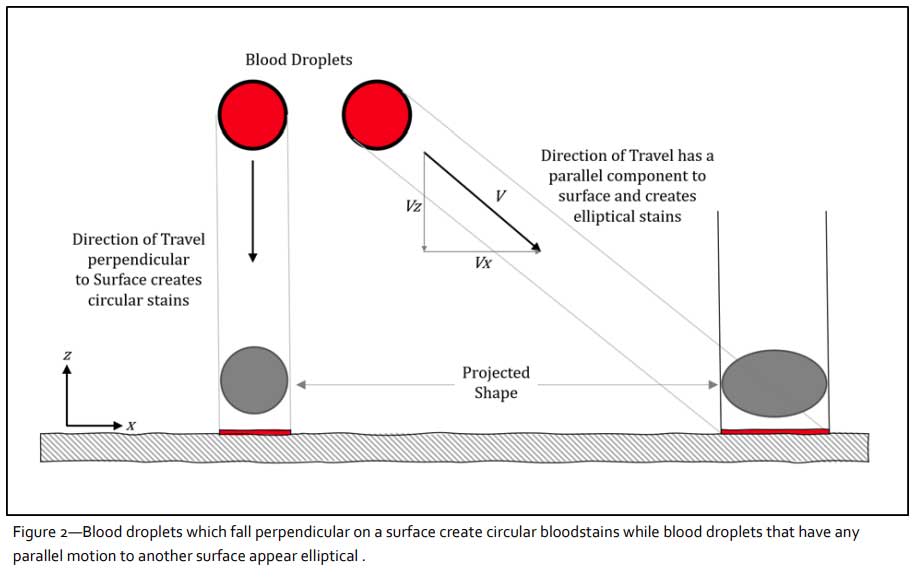
There are two conditions that can exist for any bloodstain. Bloodstains may be circular (i.e. where a blood drop hits a surface at 90° and the length and width are equal), or they may be elliptical, with the length making up the major axis and the width, the minor axis (Figure 1). Passive blood drops such as those dripping from a bloody nose while a person is standing still, appear circular, while blood drops from a person moving (i.e. having any motion component parallel to the impacted surface) will exhibit a more elliptical shape (Figure 2).
The impact angle, which is directly related to the shape of the bloodstain, can be expressed by the equation:
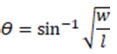
where Θ is the impact angle of the bloodstain, w is the width of the bloodstain (minor axis, e.g. 5 mm) and l is the length of the bloodstain (major axis, e.g. 10 mm).
History of the Impact Angle Equation
In his 1895 text entitled, Origin, Shape Direction and Distribution of the Bloodstains following Head Wounds Caused by Blows, Eduard Piotrowski ran a series of experiments looking at bloodstain impacts. One of these experiments consisted of striking a rabbit on the floor and noting the impact patterns created on a set of temporary walls lined with paper. Different instruments were used to create the blows and subsequent strikes caused blood volumes to break free into airborne droplets. He noted that the shape of the bloodstains differed significantly and could often approximate the originating location. 3
Approximately 40 years later, four French researchers, Victor Balthazard, René Piédelièvre, Henri Desoille, and Léon Dérobert ran several experiments with rabbits. Some tests involved drops which fell from different heights, striking different textured surfaces including textiles. They incorporated oblique targets set to specific angles and utilized high speed “cinematographic” stop motion filming with rapid pulse strobe lighting to assist in their data collection.4 Their work culminated in a research paper they presented and later published just a few months before France was engulfed in the second World War.
The research conducted by Dr. Balthazard et al. generated a ratio with the width divided by the length of a stain that strikes the surface at an angle relative to the surface. Here they were measuring outer edges of the width and length of these stains. They ran into difficulty in determining the end of extremely elongated stains such as those they created at impacts of 5°, especially as the drop fall height was increased. Part of the reason for this was because they were measuring from the leading edge of the bloodstain to the tail and not the bloodstain ellipse alone.
In his 1953 text, entitled “Crime Investigation: Physical Evidence and the Police Laboratory”, Paul L. Kirk illustrated the relationship between width and length of a bloodstain in a similar fashion. Here Dr. Kirk dripped blood from varying heights onto different angled boards of incline. These were set to specific degree slopes to create different sized/shaped stains. He too did not notice a direct trigonometric relationship between drip stain shape and the angle at which it struck the surface.5
In 1955, Professor of Physics Dr. Conrad Rizer published “Police Mathematics – A Textbook in Applied Mathematics for Police” in which he stated that the half lengths of the ratio of width to length are found to be the sine of the impact angle between the surface and tangent to the trajectory of the bloodstain at the surface. Thus, Dr. Rizer not only states the trigonometric relationship of the width and length, but also that droplets of blood travel in a parabolic arc along their trajectory.6
Bloodstain Ellipse Marking Accuracy
In 1971, Herbert Leon MacDonell and Lorraine Fiske Bialousz published a text that provided an explanation of the stringing technique used by Mr. MacDonell in the late 1960s at crime scenes.7 The stringing technique relies on the analyst to mark the direction and impact angle of an individual bloodstain represented by a string, indicating its approximate flight path.
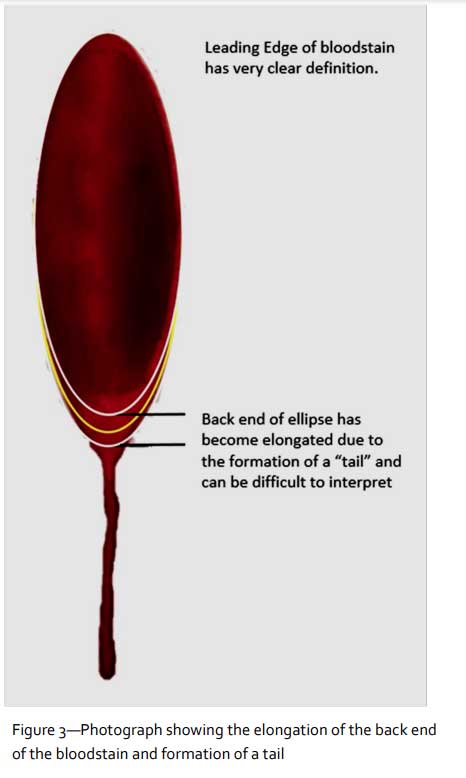
Virtual stringing methods and area of origin analysis brought to light by initial efforts of Dr. Fred Carter with his software program “Tracks” 1992 still depend on the marked bloodstain ellipse to calculate the impact angle.8 Previous attempts at understanding the effect of errors on the estimated droplet trajectory began as early as 1994, when Pat Laturnus conducted a measurement survey based on a series of ten drip stains generated from an eye dropper. Each of these blood drops struck a target set to various known inclination angles. Mr. Laturnus mailed sets of photostat copies to members of the International Association of Bloodstain Pattern Analysts (IABPA) and received replies from twenty-seven individuals.9 His findings concluded the determination of the width of the stains was very consistent amongst the participants although a significant difference in lengths was quite obvious. Part of the issue with marking real bloodstains is that the stains may often be malformed and do not have a clear elliptical outline. Thus, analysts must use subjective judgment to determine where to place the back end of the ellipse (i.e. most often where malformation occurs). The survey brought to light how different minds perceive the length of the stain differently (Figure 3).
Dr. Fred Carter’s original Trajectories and later his BackTrack program 10 superimposed a thin line ellipse impression over the chosen spatter stain to greatly diminish the ambiguity of measuring an ellipse using manual stain measurement tools such as an eye loupe or caliper. Today, the ellipse overlay method and perimeter shape manipulation to best fit a bloodstain are the bases for most, if not all computer based analytical methods.
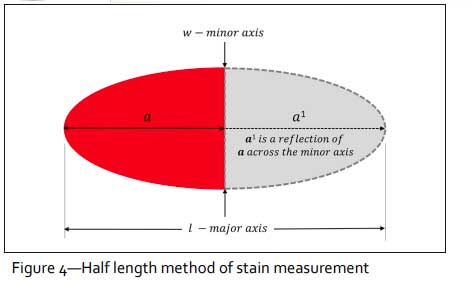
In 2008, Dr. Mark Reynolds submitted a thesis entitled, “Bloodstain size, shape and formation: implications for the bloodstain pattern analyst”.11 In his thesis, Dr. Reynolds ran a study on using computer assisted ellipse marking using Microsoft Excel 2003 with Auto Shape tool. He found that it was possible to produce a more accurate and precise estimate of the blood droplet impact angle over manual processes available. It was also noted that the most critical refinement to the ellipse fitting method was that it allowed for the symmetrical half (trailing end of the bloodstain) to be mirrored across the width, which maintains the mathematical integrity of the ellipse during the measuring process. Although this method had been used by others, it uses the principles that Dr. Conrad Rizer first indicated, whereby the half lengths of the major and minor axes are used instead of the overall measurements (Figure 4).
Examination of the Sine Curve from 0° to 90°
When considering bloodstains to be used for computer reconstruction purposes, the first thing that needs to be established is how well do humans measure bloodstains through computer software? Posed in another, more basic form, how well can a human draw a computer ellipse using superimposed elliptical shapes over a bloodstain image? As with most measurement exercises, the understanding of errors, how they propagate and what effect they have on a final result is important to address. There are of course many reasons for why a bloodstain may be poorly marked, such as a low resolution image, malformed bloodstain, analyst bias, experience, etc. However, there are also factors related directly to how the sine function operates and having an understanding of this aids in establishing best practices in bloodstain selection and area of origin analysis.
A Sine wave is “a waveform that represents periodic oscillations in which the amplitude of displacement at each point is proportional to the sine of the phase angle of the displacement and that is visualized as a sine curve”.12 Sine waves can have a stretched out or compressed appearance (left to right), which would refer to its frequency, while the height of the curve above and below the x-axis (marked ?) would refer to its amplitude.
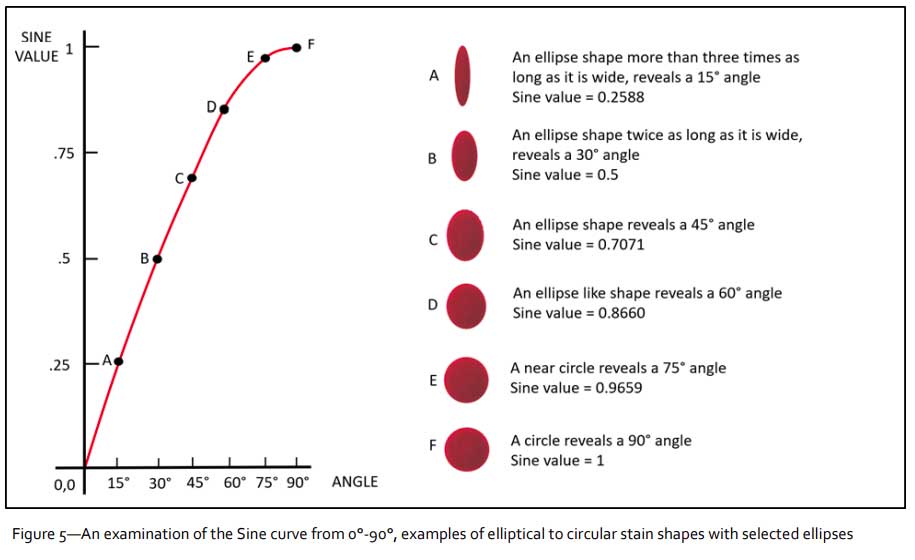
Figure 5 shows part of a sine curve where there are six reference points representing different bloodstain impacts, labeled “A” through “F”. Starting at the origin, 0° and moving to the right along the x-axis to 15°, one will have simultaneously moved from a sine value of 0 up to 0.2588 identified as point “A”. However, moving the same difference of 15° by starting from the top of the curve at 90° (Point “F”) and moving to 75° (Point “E”), the sine value has gone from a value 1 to 0.9659 for a difference of 0.0341. Thus, at impact angles closer to 90°, a large change in the ? value, creates a small change in the sine value. Stated another way, a small change in the sine value (i.e. errors in marking an ellipse) has a larger effect on the resultant impact angle for stains with an impact angle closer to 90°.
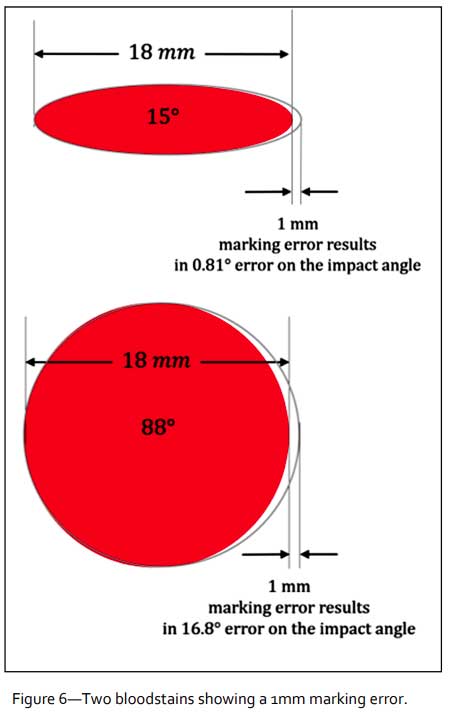
This can be exemplified in a theoretical example where a person makes a small marking error when marking a bloodstain ellipse. Assume that an analyst makes the same marking error of 1 mm (i.e. overestimation of the length) for two different bloodstains with impact angles of 15° and 88°. The 1 mm error creates resultant impact angles of 14.2° and 71.2° with errors of 0.81° and 16.8°, respectively (Figure 6). Thus, the sensitivity to errors at higher impact angles is much greater than for lower angles.
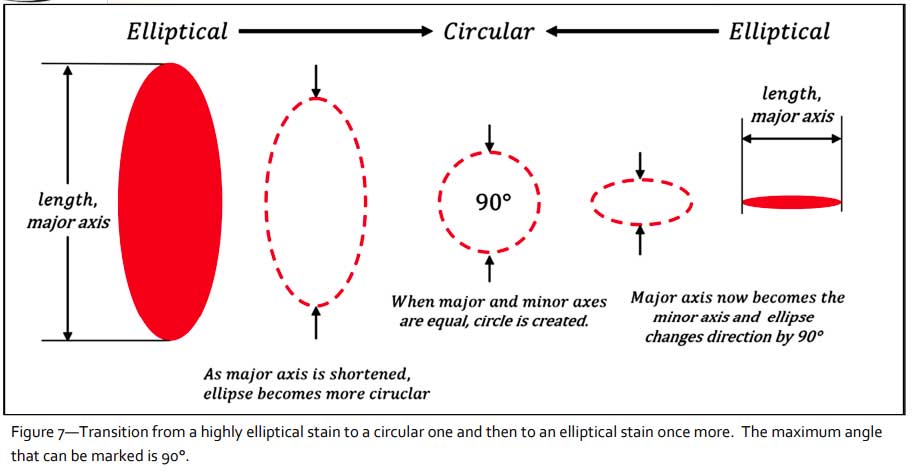
The maximum angle for any bloodstain is always 90° and it can be rather difficult to determine the direction of a drop that is close to circular. This is partly because as the length (major axis) of a bloodstain approaches equivalence with its width (minor axis), the bloodstain becomes circular. Should the original length continually decrease, the original length and width orientations are swapped, where the long axis of the stain is rearranged from vertical to horizontal. This is shown in Figure 7.
METHOD
A series of 18 bloodstain images were created using 3ds Max,13 which is a 3D modeling and animation program used in the film industry but also for scientific visualization. Elliptical shapes were drawn to have exact proportions of length and width that would correspond to a known impact angle. The bloodstain images were 1600 x 1600 pixels and the ellipse lengths ranged between 830 and 1370 pixels. The range of angles covered by the images were from 5° (highly elliptical) to 90° (perfectly circular) in increments of 5° as shown in Figure 8.
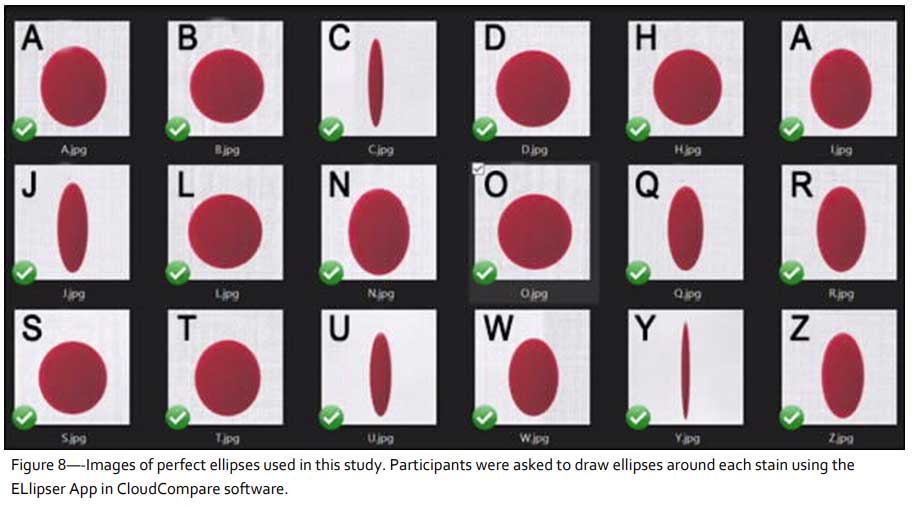
This data set of images was made available to participants through an online link which included a data sheet, video tutorial and instructions. The software used to mark ellipses in this study was the ELlipser App 14 which can be found in the CloudCompare software.15 CloudCompare is a point cloud processing program which is freely available online and is available for PC and Mac. This allowed participants easy access to software that would otherwise be proprietary and difficult to obtain. In addition, participants of varying experience levels were asked to participate, and their experience level was voluntarily provided on a scale of 1 (low) to 10 (highest experience level). The average recorded experience levels of 86 participants was 5.65. The remaining participants chose not to include their experience level.
The setup process was rather simple and once the program was installed, CloudCompare would be launched and the ELlipser application would be initiated. The ELlipser App allows the user to load images and subsequently use an ellipse marking tool to mark bloodstains. Zoom and panning controls were available by using the mouse wheel and right mouse button. Once a participant was satisfied with the placement of the ellipse, they were asked to copy the value in the “theta (deg.)” field which was the reported impact angle for the ellipse.
All the data was compiled in Excel and organized by impact angle to observe the effect of marking errors to the known angles (i.e. ground truth), trends and where the greatest errors might present themselves.
RESULTS
When looking at the overall set of errors in ellipse marking, the mean errors and absolute mean errors were considered. The absolute mean errors are greater since they do not balance positive and negative values. Thus, absolute values of error give a better understanding of the overall errors without considering the direction of the actual values.
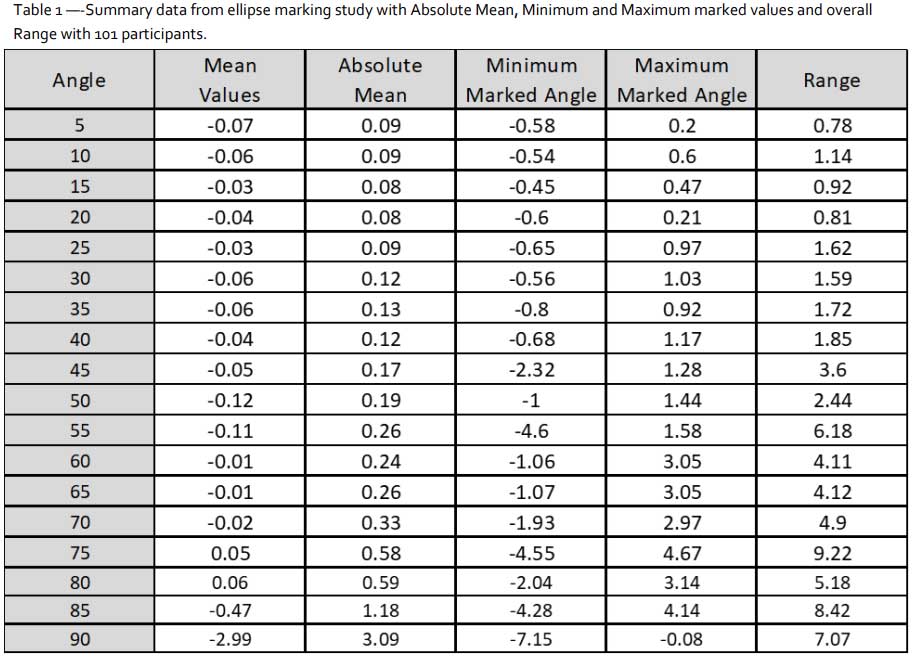
The results are noted in Table 1 and show that the largest individual measurement errors and largest range of errors (i.e. minimum to maximum) appear closest to 90°. There is an increase in the variability of errors and extreme values above approximately 60° with a significant spike at 90°. The boxplot in Figure 9 shows all the error data from every participant and demonstrates how the variance and risk of outliers increases as the ellipse moves from 5° to 90°. This increasing error can be demonstrated when considering the data in various forms (Figures 10-12).
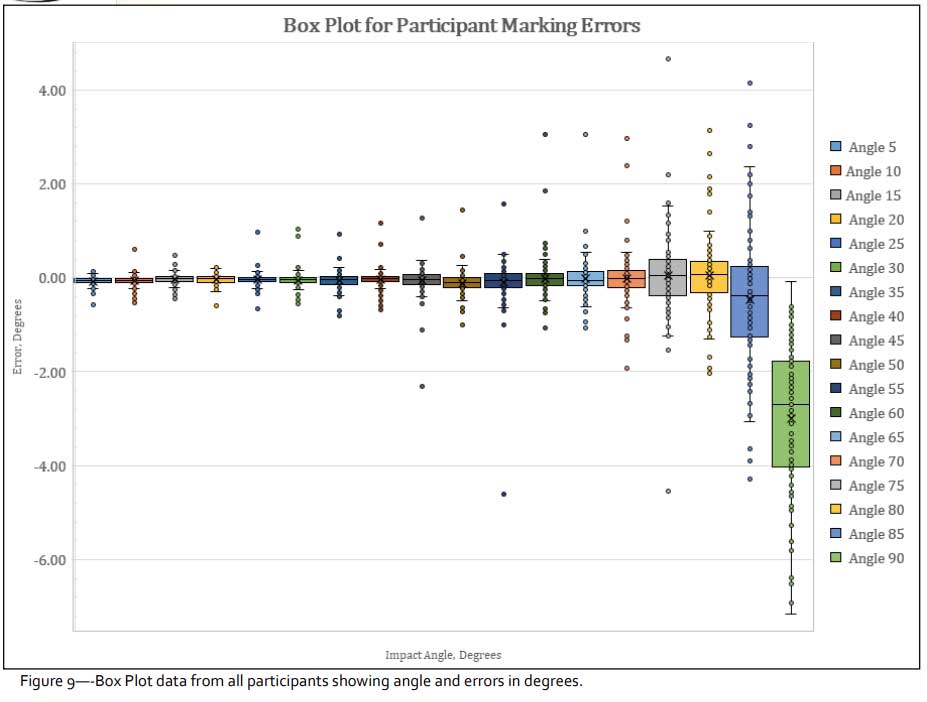
The outliers which are seen in Figure 9 are much less frequent and less extreme below 55° where only two values appear greater than 2°. Above 55°, there were dozens of errors greater than 2° with some extreme values above the 7° mark.
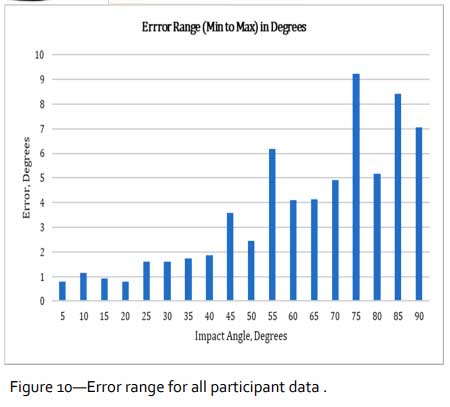
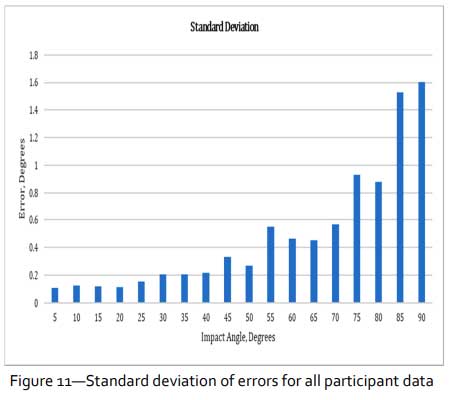
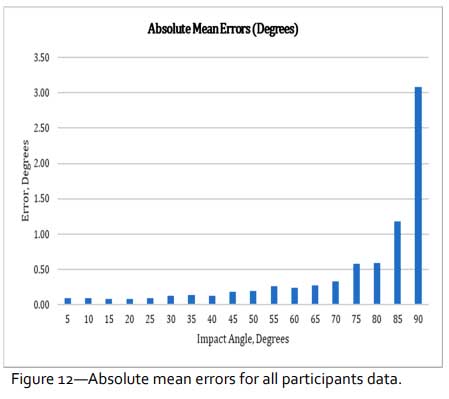 Figure 10 also gives a sense of the variation in marking as it can be noted that the range between extreme values marked for any one impact angle increases significantly closer to 90°. Similarly, this is reflected in the standard deviation of values in Figure 11 which shows the same trends of increasing standard deviation closer to 90°.
When looking at the mean absolute errors in Figure 12, the extreme spikes are “softened” and it can be noted that mean absolute errors are below 0.2° up to impact angles of 50°. The graph of Figure 14 is also quite consistent in the relationship of increasing errors to increasing impact angle. Mean absolute errors only exceed 0.5° at impact angles of 75° or greater. The smallest mean errors were observed at impact angles of 5° to 25° with values below 0.1°.
DISCUSSION
As mentioned earlier, sensitivity to ellipse marking errors for impact angles which are close to circular (i.e. 90°) can cause large changes in the resultant impact angle. The results of this study show that marking errors for geometrically perfect ellipses are not static and vary depending on how circular or elliptical bloodstains appear. In cases where there are spikes in the standard deviation bar graph, (e.g. at the 55° and 75° positions), these are where participants marked ellipses with extreme errors/outliers. It is difficult to say exactly why there are spikes in the data at these particular positions other than to surmise that there is greater difficulty in marking ellipses at higher impact angles while some of the marking errors could be attributed to lack of familiarity with the ELlipser App or to the level of experience of the participants. Notably, the first stain presented in the data set was “A” with a value of 55°. It is possible that the errors at this angle were due to participants becoming familiar with the ELlipser App. However, this would not explain why there was a similar spike at 75° since this was the fourth bloodstain presented in the random sequence of images presented. Should this approach be revisited, the authors may provide participants with practice ellipses, prior to the start of the study giving participants greater operational knowhow thereby reducing the potential for marking errors.
Ellipse marking errors near 90° have a natural bias of underestimation. This can be explained by the fact that it is not possible to have a value greater than 90° as the ellipse simply changes direction (i.e. gamma angle direction). Thus, the mean and median in the box plot of Figure 10 are well below 0° and it is not possible for any values to have positive errors. Similarly, at the 85° impact angle, it is noted that there appears to be a bias with the mean falling below 0° and thus, there appears to be an underestimation in the ellipse angle.
CONCLUSION
Errors with respect to ellipse marking cannot be summarized as a single number since errors change with respect to the angle of impact. Thus, a different model for errors should be proposed. Below 60°, there are fewer outliers, less variation and except for 2 points seen in this study, all errors fell within 2° of the known impact angles. Care should be taken when analysts are dealing with bloodstains that are near circular as errors may be greater than 7°. The mean error graph attests to the benefit of taking multiple samples for any one ellipse measurement as spikes and outliers have a reduced effect in the overall data.
Software programs that use superimposed ellipses and semi-automatic or fully automatic marking are subject to the same sensitivity towards errors at impact angles closer to 90°. In addition, the contrast and quality of images play an important role in the result of an automatic marking implementation. Photographs of bloodstains must be taken at 90° to the surface to avoid perspective distortions. Hence, it is still recommended to have the analyst oversee and supervise any current methods of automatic detected ellipses especially since in practice, blurred images, low resolution images, extended tails, textured surfaces or other spatter stain defects will all contribute to subjectivity and the potential for increased error.
These findings have generated an additional research initiative by both authors using actual bloodstains to determine what, if any further errors would appear when using computer ellipse marking methods. Testing with a large sample size of participants is recommended with real bloodstains to see if errors increase due to added subjectivity. In addition, testing the performance of automated programs and how well they can mark ellipses should be an area of study since artificial intelligence and other proposed marking schemes are naturally not far off in the near future. Ultimately, this study has shown that using a virtual ellipse marking method on a series of high quality, digitally created bloodstains, marking errors are relatively small in a range of impact angles between 5°-75°. Errors greater than 7° may be apparent when impact angles approach 90° although the majority of errors between impact angles of 75°-90°, were below this level. However, in each case, the effect of these errors needs to be considered with respect to the type of analysis being performed. Taking this information into the field, selecting elongated stains can reduce measuring errors and therefore minimize the error in determining the area of convergence or the 3D area of origin.
References
- Organization of Scientific Area Committees for Forensic Science. (2017). Terms and definitions in bloodstain pattern analysis. ASB Technical Report 033.
- Illes, M., & Boués, M. (2011). Investigation of a model for stain selection in bloodstain pattern analysis. Canadian Society of Forensic Science Journal, 44(1), 1-12.
- Piotrowski, E. (1895). Über Entstehung, Form, Richtung und Ausbreitung der Blutspuren. Virchows Jahresber I, Wien. Reprinted/translated “Origin, Shape Direction and Distribution of the Bloodstains following Head Wounds Caused by Blows.” Elmira, NY (1992): Golos Printing 1 – 32, page 31.
- Balthazard, V. (1939). Etude des gouttes de sang projete. (Study of Projected Drops of Blood)." In: Annual Medecine Legale Criminol, Paris, France: 22nd Congress of Forensic Medicine, (1939): 265-323, page 295.
- Kirk, P. L. (1953). Crime investigation; physical evidence and the police laboratory, pages 178 & 179.
- Rizer, C. (1955). Police mathematics: a textbook in applied mathematics for police, pages 72-73.
- Personal communication between MacDonell and Moore, circa 2005, Corning, NY.
- Carter, A.L., Carleton University, Ottawa Canada. Registered Trademark 1992
- Laturnus, P. (1994). Measurement survey. International Association of Bloodstain Pattern Analysts News, 10(3), 14-32.
- Carter, A. L et al (2005). Further validation of the BackTrack (TM) computer program for bloodstain pattern analysis: precision and accuracy. IABPA News, 21(3), 15-22.
- Reynolds, M. (2008). Bloodstain size, shape and formation: implications for the bloodstain pattern analyst.
- Merriam Webster, https://www.merriamwebster.com/dictionary/sine%20wave?utm_campaign=sd&utm_medium=serp&utm_source=jsonld (Accessed December 14, 2019).
- 3ds Max, https://www.autodesk.ca/en/products/3ds-max/overview, Autodesk, Inc. San Rafael, CA,USA.
- ELlipser, developed by Eugene Liscio, P.Eng. & Daniel Girardeau-Montaut, Eng., PhD, 2017. Available through https://danielgm.net/cc/.
- CloudCompare, https://danielgm.net/cc/, (Accessed December 14, 2019).
About the Authors
Eugene Liscio, P.Eng. ai2-3D, Woodbridge, CanadaCraig C. Moore, BSc. See More Forensics, Grimsby, Ontario, Canada
This work is licensed under a Creative Commons Attribution 4.0 International License.
Attribution — You must give appropriate credit, provide a link to the license, and indicate if changes were made. You may do so in any reasonable manner, but not in any way that suggests the licensor endorses you or your use.
This article appeared in the JBPA, Volume 35, Number 3. The Crime Scene Investigator Network gratefully acknowledges the authors for allowing us to reproduce the article.
Open Access: The International Association of Bloodstain Pattern Analysts Journal is an Open Access publication with all accepted and published manuscripts available at www.iabpa.org to members of the International Association of Bloodstain Pattern Analysts and the general public with permitted reuse. Prior to publication, the Journal will obtain a Creative Commons Attribution (CC BY) license for all accepted manuscripts. This license allows for the distribution of published manuscripts provided proper credit is given to the author(s).
Article posted January 6, 2023