
Accuracy of Area of Origin Analysis on Textured, Wallpaper Surfaces
Gareth Griffiths
Eugene Liscio, P.Eng.
Dean Northfield
Abstract
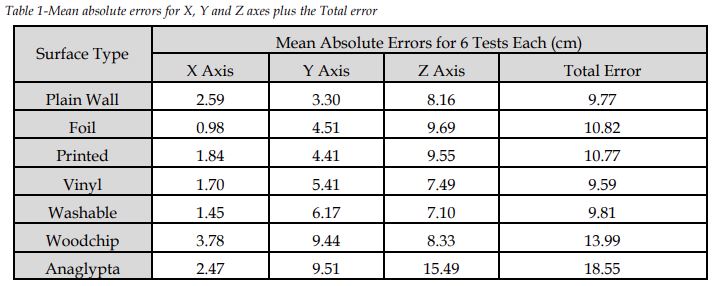
Bloodstains at crime scenes can be deposited or projected on many surface types, and the importance of Area of Origin (AO) calculations for impact stains are vital in the sequence of events. In the UK, wallpaper is a common material used to decorate walls. This study looked at the effect different wallpapers had on the calculated Area of Origin (AO) using FARO Zone 3D (FZ3D) software. A variety of wallpaper types were used, such as Foil, Printed, Vinyl, Washable, Woodchip and Anaglypta. These consisted of smooth and rough surface textures while the control was a plain painted wall. For each wallpaper type and control plain wall, six repeated impacts were conducted. An impact rig with a spring tension arm was fixed 45 cm from the X wall and 45 cm from the Y wall, and remained the same throughout the experiment, to resemble an impact blow for a bloodletting event. The location was also known to the analyst. AO error co-ordinates were measured directly in the FZ3D software to the known impact location, and the results were analysed. An overall 30 cm maximum allowable error from the known impact location was chosen since it was expected that textured surfaces would not perform as well. Nonetheless, 30 cm can still distinguish between a person that is low to the ground, kneeling or standing. The mean AO errors for each wallpaper type were Plain wall, 9.77 cm, Anaglypta wallpaper, 18.55 cm, Woodchip wallpaper, 13.99 cm, Washable wallpaper, 9.81 cm, Foil wallpaper, 10.82 cm, Printed wallpaper, 10.77 cm and Vinyl wallpaper, 9.59 cm. The maximum error for any one impact test was 24.81 cm which was within the chosen 30 cm limit. Wallpapers that had highly textured surfaces had the greatest errors. Also, FZ3D is shown to be an acceptable tool when analysing impact bloodstain patterns on different wallpaper types.
INTRODUCTION
In recent years, scientists and law enforcement agencies have been introduced to sophisticated technologies, which assist in bringing criminals to justice or to prevent an innocent individual from being convicted.1 Among the variety of recent additions of technology, experts and jurors see a dramatic change in metrological technologies - the scientific study of measurement. Innovations from forensic science research and development are introducing these new techniques for the purpose of crime solving, and increasing the reliability, efficiency and validation of forensic testing.2 Software packages such as HemoSpat,3 , BackTrack4 and FARO Scene5 have been independently tested, compared and validated through published, peer reviewed scientific articles. In addition, these software packages have been available for many years to allow for the analysis of bloodstains in a digital manner by utilising photographs and measurements to determine the Area of Origin (AO). The AO is defined as the threedimensional area from which impact stains originated. The AO is defined as the threedimensional area from which impact stains originated. The angle at which a blood droplet impacts the surface can be determined by a relationship, first observed by Dr. Victor Balthazard and subsequently formulated by Dr. Conrad Rizer. The angle (θ) is determined by taking the arcsine of the ratio between the width (W) and length (L) of an individual blood droplet, (θ = sin-1 (W/L). Crime scene investigators use this calculation when utilising the traditional stringing method to determine the angle of impact.
More recently, FARO Zone 3D (FZ3D) has been introduced to the Blood Pattern Analysis (BPA) community to document bloodstains, and to determine the AO of bloodstain located at crime scenes. The AO is determined by measuring several individual bloodstains and extrapolating their backtracked trajectories to the closest point of intersection in threedimensional (3D) space, utilising a modified tangent method. For the purpose of this study, only upward moving stains were selected for analysis. Since the release of FZ3D, there have been no published scientific accuracy validation studies for the AO on different wallpaper types utilising FZ3D. Reviews of forensic science and changes to case law, such as that by the National Academy of Sciences and the 1993 Daubert decision, have recognised the need for research to address the accuracy and reliability of methods employed in forensic science.6,7 As such, there is a need for practical studies of error, reproducibility and uncertainty in BPA. Terrestrial Laser Scanning (TLS) has become popular since the late 1990s, with the intention of surveyors and engineers to survey buildings,8 terrain, and other architectural features.9 Over recent years, TLS has been introduced to the forensic field to assist in documentation for applications such as clandestine graves, vehicle collision reconstruction, bullet trajectory documentation, BPA, and suspect height analysis. Bloodstains can be located on many surfaces at a crime scene such as walls, furniture, and floors. Walls in the United Kingdom are commonly decorated with wallpaper, and this poses a problem since most studies looking at the AO are based on smooth plain walls. The aim of this research was to identify the effect different wallpaper types have on the AO of bloodstains.
METHOD
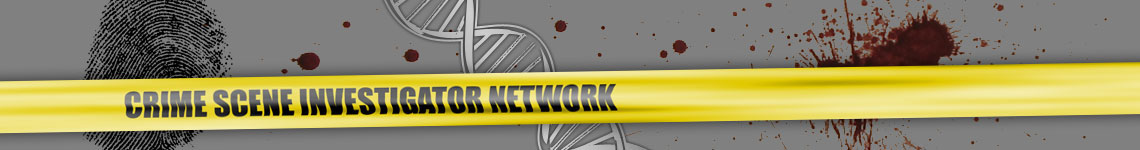
Two sheets of hardboard measuring approximately 48”x 48” (122 cm x 122 cm) were cut and placed adjacent to each other, to create a 90° corner wall. The X axis was chosen as the right wall, Y axis was the left wall and Z axis was the height from the floor. A 90° wall was utilised to represent a more complex scenario instead of using a single flat surface as shown in Figure 1 and Figure 2.
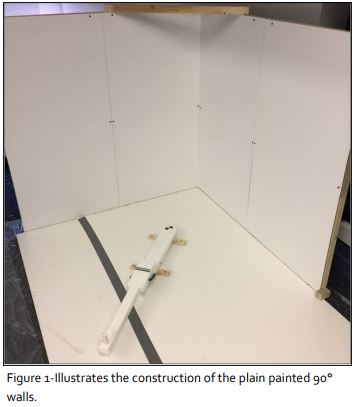
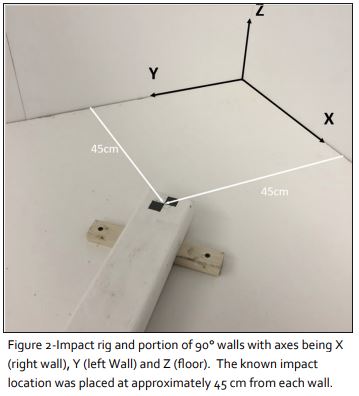
For each impact, wallpaper was applied to the X and Y walls with Elmer’s adhesive spray and left to dry for 10 minutes (as per the manufacturer’s recommended drying time), these wallpapers were Foil, Printed, Vinyl, Washable, Woodchip and Anaglypta. Figure 3 represents the different wallpaper types utilised. For the purpose of this experiment, six repeats were conducted for each wallpaper type and the control plain wall, resulting in 42 impacts being created. A custom-made impact rig, shown in Figure 4, was used to create each impact stain. The rig was screwed to the (Z) floor, with the centre of impact at 45cm from the X wall and 45cm from the Y wall, this being the known AO, as seen in Figure 2. This remained the same throughout the experiment for all 42 impacts created.
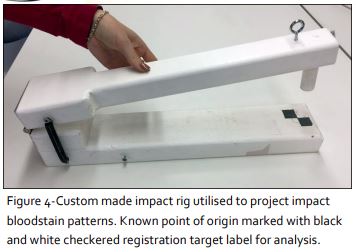
A reference target was aligned to the centre of the impacting dowel on the rig to measure the known point of impact (or centre of impact). Approximately 5 mL of sheep blood (used in previous studies and obtained from the Canadian Food Inspection Agency)11 was applied onto the reference target located on the impact rig, with a 10 mL disposable resin syringe. This was repeated for each impact. The blood was preserved in 1% Sodium Fluoride and Potassium Oxalate and stored at 4°C in a refrigerator. Prior to use, the blood was warmed to 37° C to emulate the temperature of human blood and lightly mixed for homogeneity.
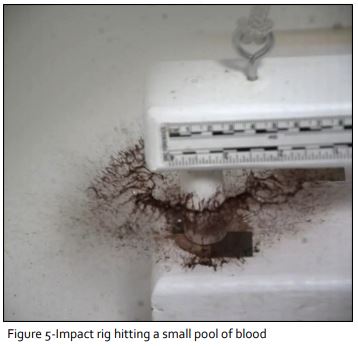
The impact rig utilized a swinging armature, and when pulled back to 90° from its resting position created tension in a spring. When released, the armature, swung forward and the impacting head encountered the 5 mL of sheep blood on the checkered target to create an impact (Figure 5). Utilising a custom-made impact rig reduced human intervention and variability of the impact, resulting in more consistent impact speeds.
Visual Analysis and Digital Documentation
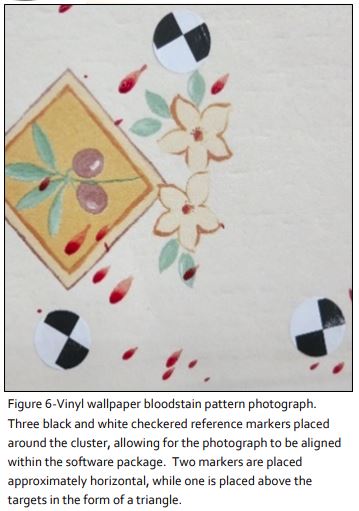
Once the bloodstains had been projected onto the X and Y walls utilising the impact rig, inspection of the bloodstains was carried out. The inspection of the bloodstains consisted of identifying stains which were the most suitable for analysis. Previous studies recommend the use of more elliptical bloodstains to provide a better estimation of the angle of impact.10 FZ3D requires high resolution photographs of the bloodstains for the analyst to mark individual bloodstains as ellipses. When available, clusters of multiple bloodstains located in groups were preferred. Using a cluster of bloodstains reduces the workload since fewer numbers of photographs are required to be taken and analysed. Three black and white registration markers were placed around each cluster; this allowed the captured photographs to be scaled and oriented to the laser scanned data by referencing the same markers. A Canon PowerShot S100 camera with a built-in digital zoom lens was utilised to capture photographs of the bloodstain clusters seen in Figure 6. Each captured photograph had a resolution of 4000 x 2248 pixels and was captured without the camera flash. Whilst capturing the photographs, it was necessary for the camera to be positioned perpendicular to the surface. This is important since FARO Zone 3D does not correct for perspective distortion and so ensuring the photo is “square” to the bloodstain surface limits the amount of error introduced by a non-orthogonal photograph. The use of a tripod is recommended for best practice, however, for the purpose of this study, photographs were taken free-hand, perpendicular to the surface, similar to previous studies. Lens distortion may also introduce issues with poor image alignment, and in order to minimize this occurring, wide angle lenses are not recommended.
Terrestrial Laser Scanner (TLS)
A FARO Focus S350 laser scanner was utilised in this study, which was positioned approximately 1 meter away from the X and Y walls during documentation. The laser scanner is a device which emits an infrared laser beam and can measure the position that a point is located at. This is achieved by recording the horizontal and vertical angle of the emitted laser beam and the intensity of the signal which is returned to the unit. The laser scanner captures photographs and stitches them into a panoramic image in order to colorize the captured data points. Thus, for every single point which is documented, the laser scanner provides the x, y and z position of any individual point, the intensity of the return signal, and the red, green and blue pixel information captured by the camera. In total, there could be millions of points captured by the laser scanner depending on the resolution setting of the scan. It also must be noted that the FARO S350 laser scanner has an accuracy of ±1 mm.11 Previous papers have described the method of the laser scanner and process of FZ3D in detail.12, 13 In this study, the scanner was set to conduct a full 360o scan of the bloodstain impact, with a resolution setting of ¼ and a quality setting of 4X. The output of a ¼ resolution results in a point spacing of 6.13 mm at 10 meters or 0.6 mm at 1 meter, which helps with the alignment of scan data to a photograph. These were the recommended settings from previous literature. The 4X quality setting reduced the overall noise in the scan data and increased the accuracy of the captured points. Each impact was scanned using the above-mentioned settings. The scan also included the black and white registration targets around bloodstain clusters.
Faro Scene 7.1 processing
FARO Scene 7.1 is a software package which enables the processing and management of laser scanned data. The basic process was to first import the raw scanned data into the FARO Scene 7.1 software. A processing stage allowed for the integration of colour and the optimization of the data format. The scanned point cloud data was explored in 2D and 3D in an immersive experience in full detail to ensure proper capture. The ‘Auto clipping boxes' allowed for the point cloud to be cropped to the area of interest (X, Y and Z walls with projected bloodstains). The file was then exported as an e57 file from FARO Scene and imported into FZ3D.
FARO Zone 3D
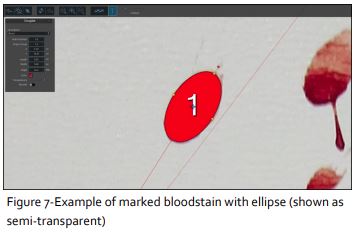
After importing the e57 file to FZ3D, the point cloud was rotated/aligned to the global coordinate system in FZ3D. The centre of the black and white registration target on the impact rig was chosen as the 0,0,0 point (the known point of origin). This was chosen because it is a relative location and it was easier to set the centre of the impact location to 0,0,0 so errors were directly readable. Once the point cloud was positioned at the centre of the grid, the bloodstain tool was used to begin the alignment of the photographs to the point cloud. Photographs of the bloodstain clusters were imported one at a time and aligned to the scanned point cloud utilising the 'Align 3-point' tool. The three reference markers seen in the photograph were selected to align the image to the same three reference markers seen in the scanned point cloud data. In some cases, where the 3-point alignment was not perfect, manual, fine adjustments of the photograph were performed by adjusting the values of the X, Y and Z positions, plus rotations about each axis. Four to six photographs were aligned to the laser scanned point cloud data, with dozens of bloodstains available to be marked. The marking and alignment of blood droplets within FZ3D relies on manual and semiautomatic tools. For the purpose of this study, the semi-automatic “Edge Detection” tool was utilised with subsequent manual adjustment, since the semi-automatic tool does not work in all circumstances. The semi-automatic Edge Detection tool allows the user to click on the centre of a bloodstain, and the software automatically calculates the best fit ellipse, illustrated in Figure 7. However, there were many instances where this algorithm fails due to poor contrast between the bloodstain and the background or because of a malformed bloodstain. Ultimately, the analyst must adjust and verify each ellipse so that it adheres well to the shape of the marked bloodstain.
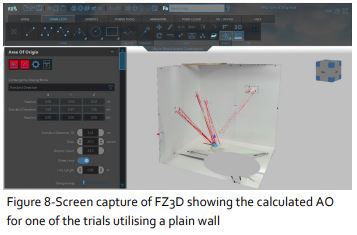
The tail on an elliptical bloodstain is useful when determining the direction of bloodstain travel just prior to impact. However, in some cases, the software misinterprets the stains' direction as being upward or downward moving. Again, the analyst must correct this by indicating where the bloodstain was traveling from prior to impacting the surface. Once the ellipse is marked, a straight-line trajectory is constructed by the software, at the calculated angle of impact which points in the direction of the impact. Verification of the backtracked trajectory for each blood droplet was required to ensure the outline and the direction of the marked stain was correct. There were a variety of colours and patterns on the tested wallpaper. Overall, the Edge Detection tool performed reasonably well. However, there were regular adjustments that were required by the analyst. Additionally, it must be noted that only upwards moving stains were selected for analysis, as FARO Zone 3D is only to be used with upward moving stains at this time, as illustrated in Figure 8.
Throughout the process, four to six photographs were chosen for each impact with approximately 10-30 bloodstains per photograph for the AO calculation. FZ3D allowed for a real-time calculation of the AO whilst marking each individual bloodstain. The calculation of AO does not exclude any results which fall below the known origin point. Once all bloodstains were marked, the AO position was reported in a properties window. A PDF report could be generated which shows the calculated AO.
RESULTS
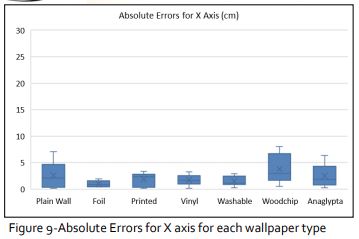
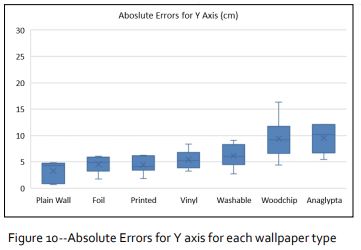
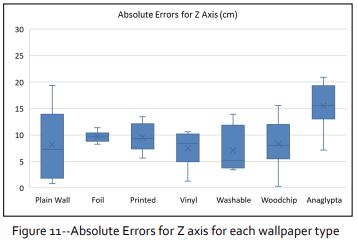
FZ3D provided the analyst with the calculated error for the X, Y and Z axes. Table 1 below illustrates the mean errors for each set of wallpapers, and the plain wall used as a control. The errors for the X, Y, and Z axes are depicted in Figures 9, 10, and 11, respectively. In relation to this study, the total error was of interest. This was defined as the three-dimensional displacement between the known AO and the calculated AO, using the 3D Pythagorean Theorem.
DISCUSSION
After reviewing the calculated AO for the six repeats of wallpaper, and the six repeats of plain wall, the total error must be considered the most important since it is the result of all the axes combined. The Foil, Vinyl, Printed and Washable wallpapers all had total mean errors at roughly the 10 cm range. When considering the Woodchip and Anaglypta wallpapers, they had noticeably greater mean errors with Anaglypta having the largest errors of all wallpaper types. Upon closer inspection, each wallpaper had unique surface properties varying from smooth to rough, to highly textured with significant three-dimensional surface texture. This is illustrated in Figure 3. When ordered from the smoothest to most textured wallpaper types, they assemble in the following order:
- Printed
- Vinyl
- Washable
- Foil
- Woodchip
- Anaglypta
Each wallpaper type had different effects on the shape of the bloodstains. The appearance of spatter striking different wallpaper types at 45° angles is depicted in Figure 12. Smooth surfaces such as the Printed, Vinyl and Washable wallpapers had very little effect on the shape of the bloodstain when it impacted the surface. The Printed wallpaper, which has a smooth surface, shows a clearly defined edge to the elliptical bloodstain. However, bloodstains become highly distorted or deformed across the Woodchip and Anaglypta wallpapers due to their highly textured, three-dimensional surfaces. These distortions make it difficult to mark an accurate ellipse shape and although the ellipse may be approximated by using some of the edge details at the exterior of a stain, the amount of subjectivity in this exercise increases.
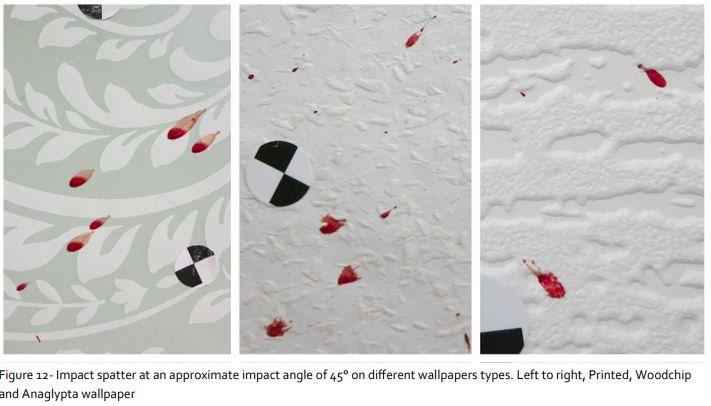
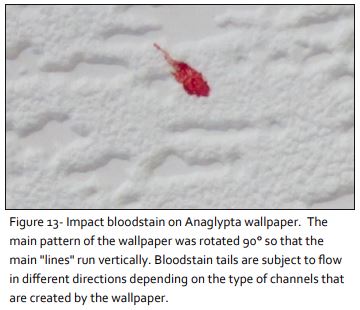
The impact spatters created in Figure 12 also show that there are voids within individual spatter stains where blood did not contact the surface of the Woodchip and Anaglypta wallpaper. This is due to high and low spots on the surface of the wallpaper where the blood drop is allowed to skip or “pass over” a lower surface. It was also noted that the tails of the bloodstains may become distorted and appear to change direction. Although this was seen more often with passive drops, there were some occurrences of this effect with impact stains. It was also noted that the chosen orientation of any textured patterns on wallpaper (i.e. a pattern that runs generally horizontally or vertically) can change the type of distortion witnessed on an impacting blood drop. Figure 13 depicts an impact stain on Anaglypta wallpaper with the pattern rotated 90° such that it runs vertically. In this case, the bloodstain is slightly better formed although the amount of distortion of the bloodstain depends on where it lands relative to the surface of the wallpaper. All tests for the Anaglypta wallpaper were performed with the pattern running horizontal when mounted on the walls. It must be also noted, when using the Edge detection tool for the Anaglypta wallpaper, the algorithm that the program uses failed from time to time on more malformed stains. When the Edge Detection tool failed manual marking of the bloodstains were performed to determine the AO. However, it must be noted that the Edge detection tool is meant as an aid and not a replacement for human marking.
Analysts may often use the tail of the bloodstain as an indicator of direction and thus, careful inspection and interpretation of any bloodstains on highly textured surfaces is warranted. Previous studies have noted that the greater distance a blood droplet travels in the air, the greater the total error for the AO. This is due to gravity and air resistance having a larger effect on the airborne blood. This error normally presents itself in the Z axis component of the calculated AO analysis. Previous studies using an impact rig at an approximate 40 cm distance from a paper lined surface showed errors in the range of roughly 5-10 cm.10 This is a similar range of errors to most of the wallpaper types used in this study (which were created using a 45 cm impact to surface distance), excluding the Woodchip and Anaglypta. Although distance from the wall was not a variable in this study, it is expected that at longer distances, projected blood travels further in a parabolic trajectory and contributes to greater error in the Z axis. At the time of writing of this study, there are no commercially available AO software programs that take gravity/parabolic paths into account. When comparing the mean values for each axis, Figures 9-11 show the higher values of error in the Z Axis compared to the X and Y axes. Although there were bloodstains across both the X and Y panels, the errors for these two axes are not equal. Not all bloodstains were distributed the same way in every impact, and it could be that depending on how the blood was placed on the rig, where the impact arm hit the blood, and other variables, the distribution of (usable stains) may vary from test to test. Thus, it is up to the analyst to choose the best stains for the AO analysis. For the purposes of this study, the researchers knew the origin location and thus, further blind tests should be completed in the future. Also, in many cases, the calculated Y axis error was greater than the X axis error. This may be due to the quality and quantity of stains chosen by the researchers or by the way the impact rig created bloodstains. In most cases, the stains were not perfectly distributed by the impact rig and had longer and more elliptical stains to a greater degree on the X-wall. As a result, more photographs were chosen on the X-wall and this could have been a contributing factor. Future studies may look at the concentration and quantity of stains on one wall versus another to determine if it is possible to influence the area of origin calculation in one direction or another.
Although there was a noticeable difference in the mean total errors between the highly textured wallpapers (i.e. Anaglypta and Woodchip) and the plain walls in this study, the mean total errors for all tested wallpapers did not exceed the chosen maximum 30 cm acceptable allowance for the AO. Previous studies, utilising a plain painted wall, reflect similar findings of this study when utilising Foil, Printed, Vinyl, Washable, Woodchip and Anaglypta wallpaper types, and the errors are within a range that can define a person either low to the ground or standing upright.
CONCLUSION
The aim of this research was to identify the effect different wallpaper types have on the AO. The BPA tool within FZ3D was used to measure the accuracy between the calculated and known AO. The results of this study showed highly textured wallpapers can produce greater errors in an AO analysis. However, the results were within a reasonable 30 cm limit when the impact rig was within 45 cm of the surface on which impact stains were deposited. Smooth textured wallpapers produced acceptable results using the bloodstain AO tool in FZ3D. Although the smoother wallpaper types tested in this study were found to behave like a plain wall, caution should always be taken when considering different substrates since wallpapers come in many different styles made from different materials. Some of these materials behave more like fabrics and some may have treated surfaces that appear hydrophobic. Thus, care must be taken when applying the results of this study to other types of wallpapers although the findings show that it is possible to perform an adequate AO analysis when bloodstain patterns are deposited on different wallpaper types. Finally, the mean total errors for all tested wallpapers did not exceed the chosen maximum 30 cm acceptable allowance for the AO. When coupled with the ability to visualise the analysis in the context of a crime scene, this makes for a powerful tool when used in a forensic investigation.
References
- Park, C.-S., Jeon, H.-P., Choi, K.-S., Kim, J.-P. and Park, N.-K. (2018), Application of 3D Laser Scanner to Forensic Engineering. J Forensic Sci, 63, 930-934. doi:10.1111/1556-4029.13632 (Accessed: 05/03/2019)
- Dutton, G et al. The Impact of Forensic Science Research And Development. National Institute of Justice, 2015. [Online] Accessed: 18/02/2019)
- Maloney, K., Killeen, J., & Maloney, A. (2009). The use of HemoSpat to include bloodstains located on nonorthogonal surfaces in area-of-origin calculations. Journal of Forensic Identification, 59(5), 513-524.
- Carter, A. L., Forsythe-Erman, J., Hawkes, V., & Illes, M. (2006). Validation of the BackTrack suite of programs for bloodstain pattern analysis. Journal of Forensic Identification, 56(2), 242-254.
- Dubyk, M., & Liscio, E. (2016). Using a 3D Laser Scanner to Determine the Area of Origin of an Impact Pattern. Journal of Forensic Identification, 66(3), 259-272
- Connolly, C., Illes, M., & Fraser, J. (2012). Affect of impact angle variations on area of origin determination in bloodstain pattern analysis. Forensic science international, 223 (1-3), 233-240. (Accessed: 01/02/2019)
- Macdonell, H. L. (2009). Bloodstain pattern interpretation. Wiley encyclopedia of forensic science. (Accessed:11/03/2019)
- Combes,M. (2014, November) Getting the whole picture with laser scanning. Retrieved from http://www.bimplus.co.uk/technology/laser-scanning/ (Accessed:02/02/2019)
- Chen, C., & Yang, B. (2016). Dynamic occlusion detection and inpainting of in situ captured terrestrial laser scanning point clouds sequence. ISPRS Journal of Photogrammetry and Remote Sensing, 119, 90-107. (Accessed:01/02/2019)
- Hakim, N., & Liscio, E. (2015). Calculating point of origin of blood spatter using laser scanning technology. Journal of forensic sciences, 60(2), 409-417.
- FARO Focus Laser Scanner (2019, FARO) Retrieved from https://faro.app.box.com/s/kcxnsakrd9bioivzwvsb2lbsrbcwe2x5/file/391565112686 (Accessed Nov 23, 2019)
- Dustin, D., Liscio, E., & Eng, P. (2016). Accuracy and repeatability of the laser scanner and total station for crime and accident scene documentation. J Assoc Crime Scene Reconstr, 20, 57-68.
- Le, Q., & Liscio, E. (2019). A comparative study between FARO Scene and FARO Zone 3D for area of origin analysis. Forensic science international, 301, 166-173.
About the Authors
Gareth Griffiths — Staffordshire University, EnglandEugene Liscio, P.Eng. - ai2-3D, Woodbridge, Canada
Dean Northfield — Staffordshire University, England
This article appeared in the International Association of Bloodstain Pattern Analysts Journal, Volume 35, Number 1. The Crime Scene Investigator Network gratefully acknowledges the authors for allowing us to reproduce the article .
![]() Open Access: The International Association of Bloodstain Pattern Analysts Journal is an Open Access publication with all accepted and published manuscripts available at www.iabpa.org to members of the International Association of Bloodstain Pattern Analysts and the general public with permitted reuse. Prior to publication, the Journal will obtain a Creative Commons Attribution (CC BY) license for all accepted manuscripts. This license allows for the distribution of published manuscripts provided proper credit is given to the author(s).
Open Access: The International Association of Bloodstain Pattern Analysts Journal is an Open Access publication with all accepted and published manuscripts available at www.iabpa.org to members of the International Association of Bloodstain Pattern Analysts and the general public with permitted reuse. Prior to publication, the Journal will obtain a Creative Commons Attribution (CC BY) license for all accepted manuscripts. This license allows for the distribution of published manuscripts provided proper credit is given to the author(s).